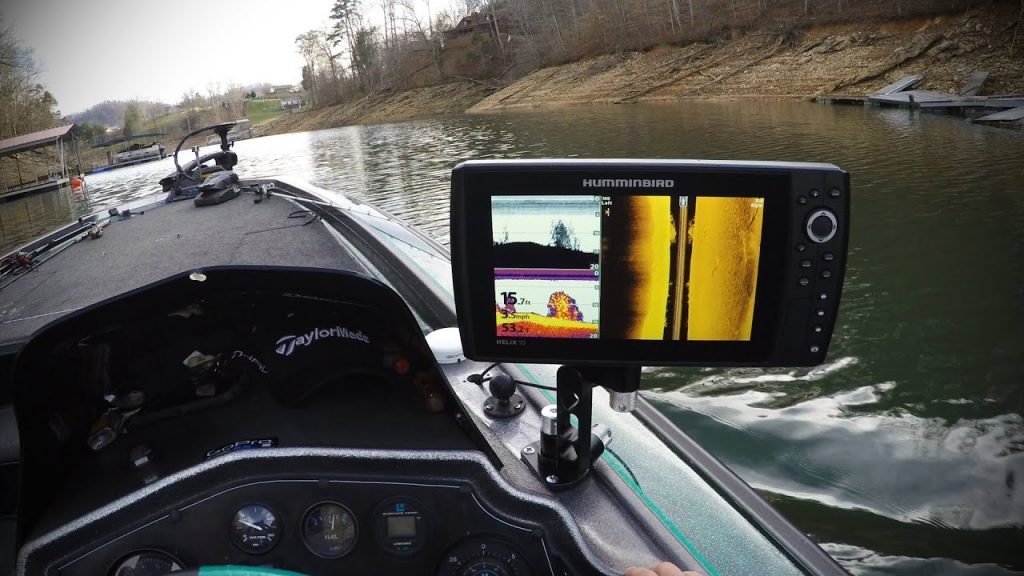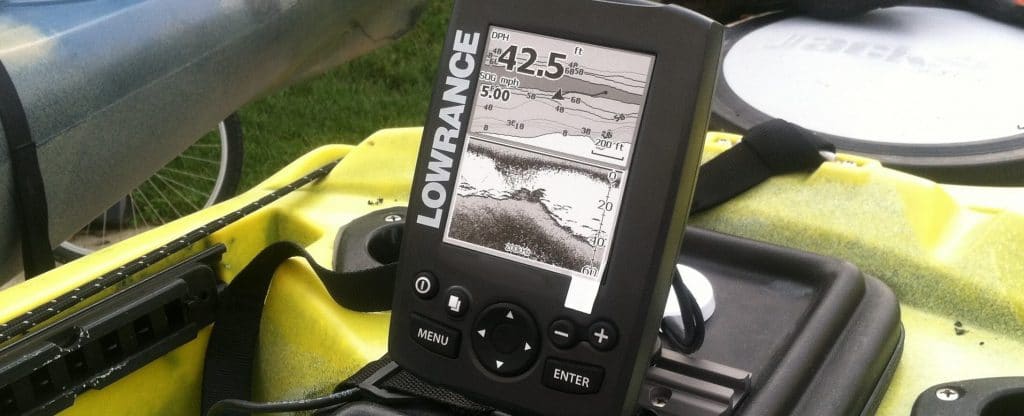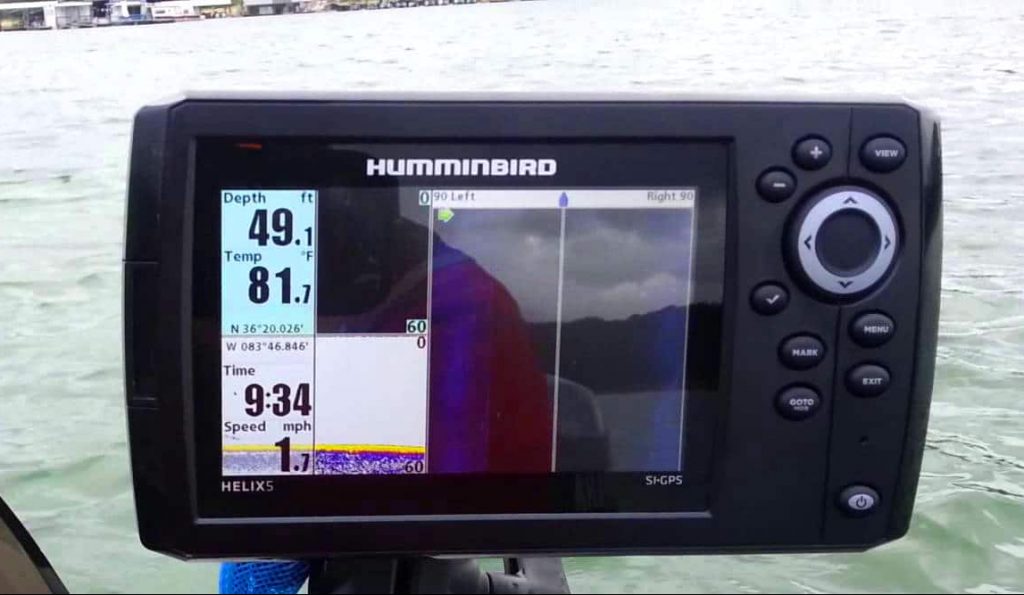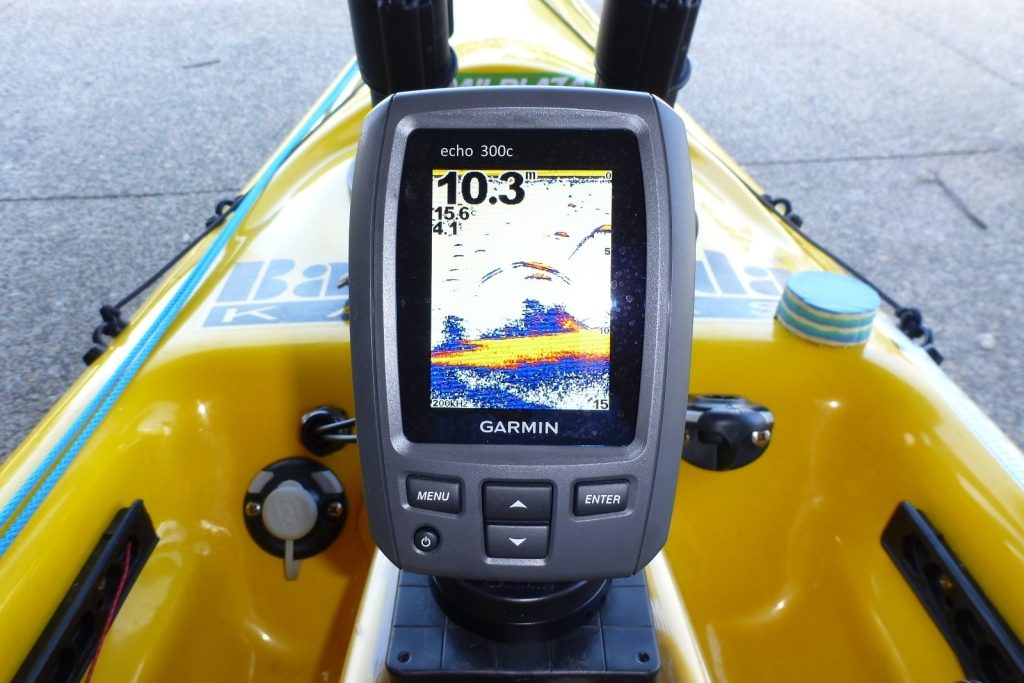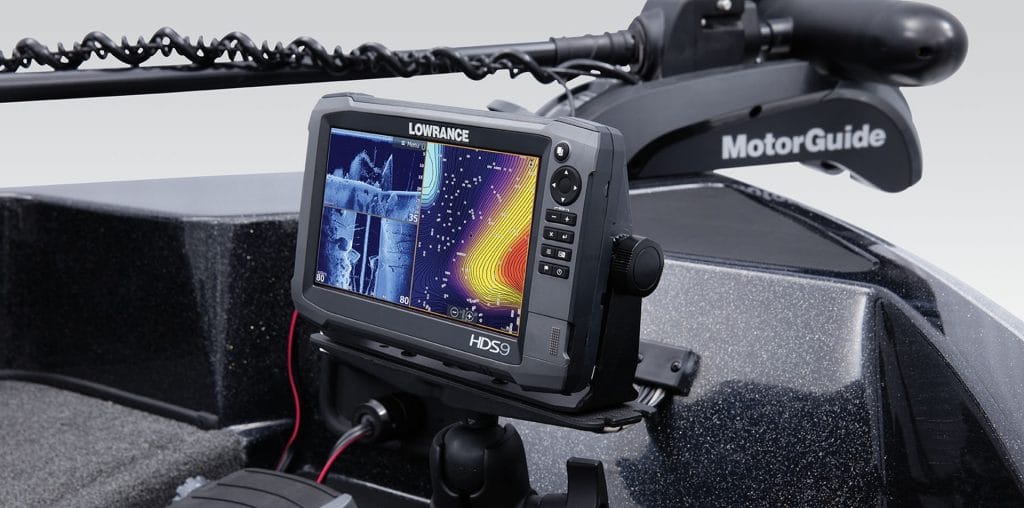

Lowrance fishfinders provide boaters, anglers, and anyone on a fishing trip with information on everything underneath their boat. Aside from fishing, fish finders are very functional devices as they give boaters some useful data concerning the locations of rocks, logs, and other obstacles that may cause boat mishaps.
Like every other device, getting the proper model is not enough to become a successful angler. You have to know how to use and how to read Lowrance fish finder. In this article, we will see how to identify fish by checking outlines and icons on the display screen.
The fish finder sends an ultrasound wave directed downwards in the form of a cone, according to a predefined frequency. When the ultrasound wave hits an underwater object like a fish or just the bottom, some of the sounds are reflected and sent back to the transducer. This then acts as a receiver and transmits the return echo to the sounder, where it is converted and amplified.
The returned echoes are analyzed and displayed on the sonar screen. We thus obtain on the screen a sort of two-dimensional representation of the relief of the background and the objects.
The device offers a great source of information since it gives a boater an idea of the relief, the nature of the bottom, the presence or absence of fish, their characteristics, etc., and this even works at great depths.
The objects found in the sea, which are the fish or the materials that make up the seabed, have a certain density. The sensors return information in the form of sound waves. Next, this information shows a difference in the density of objects hit by the waves through the returned echo.
In case of fish, for example, those have a bone or cartilaginous structure, which gives them different densities. As in the anatomy of a fish, there are organs with different densities. The first organ that the sensor detects is the swim bladder. Subsequently, it detects the rest of the organs and tissues.
Depending on the intensity, shape, degradation with which the echo has been returned, and by taking into account the different anatomy between fish, we can therefore interpret what type of fish it is.
Like all fish finders on the market, Lowrance models come in black-and-white or colored display screens. Thus, they show final images in colored forms or monochromes.
The color of the lines and icons show the strength of the echo return. The color is shown depending on how strongly the echo returns on the transducer. Here, the density and hardness of the lines and icons are the most important factors that help you interpret the object shown.
To explain how the returned echo as a function of density works, let’s imagine that we have in our hands a tennis ball. And in front of us are several walls – one of which is made of concrete, another made of wood, and the last one made of rubber.
If we throw the ball against the concrete wall, the ball will bounce back intensely, almost so much that its bounce will reach near its launch point.
If we throw it on the wooden wall, the ball will bounce back from the target point but not as far as the one that hit the concrete.
And when the ball is thrown at the rubber wall, it will absorb the blow, and its rebound power will be very small and very far from the launch point.
With sound waves, we can find something very similar to the analogy made above. It depends on what material they find on their way.
The more hard or dense the material against which the signal bounces is, the greater the intensity of the bounce will be, and the faster it will return.
Lowrance fish finders make use of the Fish ID technology in detecting fish underwater, as well as the materials. The technology converts raw data from the water bottom into a user-friendly display interface. Depending on the fish seen and the features beneath the water, the technology comes up with different icons on the display screen.
On Lowrance screens, lumbers or growing trees will appear in the form of vertical lines. Meanwhile, the icons representing aquatic vegetation are thick and well pronounced.
To know how to read Lowrance sonar fish finder, go through the following processes.
The transducer transmits signals in the water back to the fish finder. So ensure it is placed to the fish finder as close as possible.
Seaweed bottoms are very difficult to detect. This is due to the high water content of the algae, which makes it difficult to scan through. Only the most fibrous ones and with lower water content are detected. Usually, a seaweed or mud bottom returns the same echo. The stone, gravel, and gravel bottoms return a similar echo and are made up of objects with a size between 2 or 3 mm and 200 mm. Mud particles are smaller than 0.1 mm. Fine or coarse sand is made up of objects between 0.1 mm and 2 mm. And rocks are made up of objects larger than 20 cm.
Due to its hardness, the rock bottom is considered by an image with fine, sharp, and well-defined lines of the irregular or broken shape.
On a sandy bottom, the particles have a dimension between 0.1 mm and 2 mm. On the fish finder screen, we will see a wide and smooth surface of darker color at the top with very little degradation in the lower area.
Insight Genesis is a technology that lets you create your maps from the sonar data you’ve recorded. You will be able to include precise 30cm high-resolution contours, bottom hardness, and even lines of algae!
Insight Genesis enables you to create and update your cartography with Lowrance, Simrad, and B&G equipment.
It allows you to generate custom maps using Broadband sonar data from your Lowrance equipment along with information from StructureScan transducers.
The tool offers boaters the ability to create custom contour maps of their favorite fishing and boating areas. It helps you map uncharted waters or ensure that the information on already surveyed waters is accurate and current. Since it allows us to have all the information on the bottom vegetation, this is widely used for cartography in inland waters.
Knowing how to read a Lowrance fish finder is another hurdle you must get past after purchasing the equipment.
By reading what is on the screen and taking note of the type, density, and hardness of the lines, you can tell what objects are fish, sea vegetation, rock, and other water features.
On a color screen, the density captured by the waves will be interpreted in the form of color intensity. In a monochrome screen, it will be shown in different grayscales.
